|
|
|
|
|
|
|
|
|
|
|
|
|
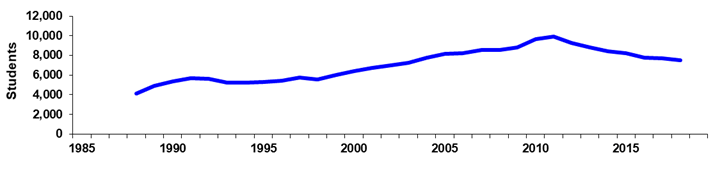
Paradise Valley Community College |
|
Spring 45th Day Historical Headcount |
|
|
|
|
|
|
|
|
|
|
|
|
|
|
|
|
|
|
|
|
|
|
|
|
|
Year |
1980 |
1981 |
1982 |
1983 |
1984 |
1985 |
1986 |
1987 |
1988 |
1989 |
|
Day |
|
|
|
|
|
|
|
|
1,832 |
2,378 |
|
% Change |
|
|
|
|
|
|
|
|
0.0% |
29.8% |
|
Evening |
|
|
|
|
|
|
|
|
2,274 |
2,526 |
|
% Change |
|
|
|
|
|
|
|
|
0.0% |
11.1% |
|
Total |
|
|
|
|
|
|
|
|
4,106 |
4,904 |
|
% Change |
|
|
|
|
|
|
|
|
0.0% |
19.4% |
|
|
|
|
|
|
|
|
|
|
|
|
|
Year |
1990 |
1991 |
1992 |
1993 |
1994 |
1995 |
1996 |
1997 |
1998 |
1999 |
|
Day |
2,870 |
3,272 |
3,338 |
2,965 |
3,090 |
2,825 |
3,056 |
3,503 |
3,185 |
3,500 |
|
% Change |
20.7% |
14.0% |
2.0% |
-11.2% |
4.2% |
-8.6% |
8.2% |
14.6% |
-9.1% |
9.9% |
|
Evening |
2,514 |
2,438 |
2,280 |
2,276 |
2,164 |
2,473 |
2,341 |
2,227 |
2,346 |
2,497 |
|
% Change |
-0.5% |
-3.0% |
-6.5% |
-0.2% |
-4.9% |
14.3% |
-5.3% |
-4.9% |
5.3% |
6.4% |
|
Total |
5,384 |
5,710 |
5,618 |
5,241 |
5,254 |
5,298 |
5,397 |
5,730 |
5,531 |
5,997 |
|
% Change |
9.8% |
6.1% |
-1.6% |
-6.7% |
0.2% |
0.8% |
1.9% |
6.2% |
-3.5% |
8.4% |
|
|
|
|
|
|
|
|
|
|
|
|
|
Year |
2000 |
2001 |
2002 |
2003 |
2004 |
2005 |
2006 |
2007 |
2008 |
2009 |
|
Day |
3,785 |
3,993 |
4,194 |
4,499 |
4,783 |
5,029 |
5,054 |
5,403 |
0 |
0 |
|
% Change |
8.1% |
5.5% |
5.0% |
7.3% |
6.3% |
5.1% |
0.5% |
6.9% |
0.0% |
0.0% |
|
Evening |
2,627 |
2,712 |
2,783 |
2,780 |
2,999 |
3,149 |
3,165 |
3,163 |
0 |
0 |
|
% Change |
5.2% |
3.2% |
2.6% |
-0.1% |
7.9% |
5.0% |
0.5% |
-0.1% |
0.0% |
0.0% |
|
Total |
6,412 |
6,705 |
6,977 |
7,279 |
7,782 |
8,178 |
8,219 |
8,566 |
8,528 |
8,804 |
|
% Change |
6.9% |
4.6% |
4.1% |
4.3% |
6.9% |
5.1% |
0.5% |
4.2% |
-0.4% |
3.2% |
|
|
|
|
|
|
|
|
|
|
|
|
|
Year |
2010 |
2011 |
2012 |
2013 |
2014 |
2015 |
2016 |
2017 |
2018 |
|
|
Day |
0 |
|
|
|
|
|
|
|
|
|
|
% Change |
0.0% |
|
|
|
|
|
|
|
|
|
|
Evening |
0 |
|
|
|
|
|
|
|
|
|
|
% Change |
0.0% |
|
|
|
|
|
|
|
|
|
|
Total |
9,639 |
9,918 |
9,244 |
8,780 |
8,452 |
8,240 |
7,778 |
7,709 |
7,486 |
|
|
% Change |
9.5% |
2.9% |
-6.8% |
-5.0% |
-3.7% |
-2.5% |
-5.6% |
-0.9% |
-2.9% |
|
|
|
|
|
|
|
|
|
|
|
|
|
|
|
|
|
|
|
|
|
|
|
|
|
|
Print in landscape for
best results |
|
|
|
|
|
Last updated on |
May 15, 2018 |
|
Source:
Official 45th Day headcount as reported by colleges. |
|
Maricopa Community College District • Office of
Institutional Effectiveness • Maricopa Trends |
|
https://asa.maricopa.edu/departments/institutional-effectiveness/data-and-projects/maricopa-trends |
|
|
|
|
|
|
|
|
|
|
|
|
|
|
|
|