|
|
|
|
|
|
|
|
|
|
|
|
|
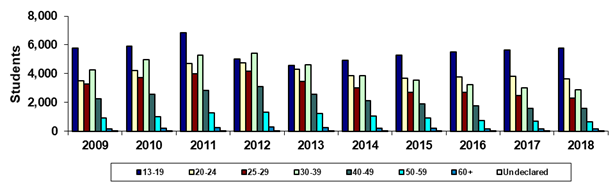
Rio Salado College |
|
Spring 45th Day Age Groups |
|
|
|
|
|
|
|
|
|
|
|
|
|
|
|
|
|
|
|
|
|
|
|
|
|
Year |
2009 |
2010 |
2011 |
2012 |
2013 |
2014 |
2015 |
2016 |
2017 |
2018 |
|
13-19 |
5,784 |
5,923 |
6,832 |
5,029 |
4,550 |
4,916 |
5,272 |
5,519 |
5,642 |
5,761 |
|
20-24 |
3,522 |
4,196 |
4,713 |
4,728 |
4,307 |
3,881 |
3,677 |
3,784 |
3,800 |
3,646 |
|
25-29 |
3,277 |
3,747 |
4,015 |
4,152 |
3,454 |
3,006 |
2,718 |
2,706 |
2,482 |
2,317 |
|
30-39 |
4,241 |
4,966 |
5,281 |
5,429 |
4,638 |
3,845 |
3,566 |
3,235 |
3,019 |
2,859 |
|
40-49 |
2,262 |
2,554 |
2,844 |
3,081 |
2,572 |
2,102 |
1,913 |
1,788 |
1,609 |
1,586 |
|
50-59 |
924 |
1,024 |
1,270 |
1,322 |
1,228 |
1,034 |
916 |
752 |
679 |
666 |
|
60+ |
175 |
193 |
255 |
282 |
254 |
214 |
202 |
173 |
176 |
159 |
|
Undeclared |
42 |
29 |
26 |
14 |
5 |
2 |
5 |
5 |
7 |
5 |
|
Total |
20,227 |
22,632 |
25,236 |
24,037 |
21,008 |
19,000 |
18,269 |
17,962 |
17,414 |
16,999 |
|
|
|
|
|
|
|
|
|
|
|
|
|
% 13-19 |
28.6% |
26.2% |
27.1% |
20.9% |
21.7% |
25.9% |
28.9% |
30.7% |
32.4% |
33.9% |
|
% 20-24 |
17.4% |
18.5% |
18.7% |
19.7% |
20.5% |
20.4% |
20.1% |
21.1% |
21.8% |
21.4% |
|
% 25-29 |
16.2% |
16.6% |
15.9% |
17.3% |
16.4% |
15.8% |
14.9% |
15.1% |
14.3% |
13.6% |
|
% 30-39 |
21.0% |
21.9% |
20.9% |
22.6% |
22.1% |
20.2% |
19.5% |
18.0% |
17.3% |
16.8% |
|
% 40-49 |
11.2% |
11.3% |
11.3% |
12.8% |
12.2% |
11.1% |
10.5% |
10.0% |
9.2% |
9.3% |
|
% 50-59 |
4.6% |
4.5% |
5.0% |
5.5% |
5.8% |
5.4% |
5.0% |
4.2% |
3.9% |
3.9% |
|
% 60+ |
0.9% |
0.9% |
1.0% |
1.2% |
1.2% |
1.1% |
1.1% |
1.0% |
1.0% |
0.9% |
|
% Undeclared |
0.2% |
0.1% |
0.1% |
0.1% |
0.0% |
0.0% |
0.0% |
0.0% |
0.0% |
0.0% |
|
|
|
|
|
|
|
|
|
|
|
|
|
Print in landscape for
best results |
|
|
|
|
|
Last updated on |
May 15, 2018 |
|
Note: A timing difference in data capture for
Spring 2015 resulted in 16 fewer students in this report than the official
number reported to the State. |
|
|
|
|
|
|
|
|
|
|
|
|
|
Source:
Official 45th Day headcount as reported by colleges. |
|
Maricopa Community College District • Office of
Institutional Effectiveness • Maricopa Trends |
|
https://asa.maricopa.edu/departments/institutional-effectiveness/data-and-projects/maricopa-trends |
|
|
|
|
|
|
|
|
|
|
|
|
|
|