|
|
|
|
|
|
|
|
|
|
|
|
|
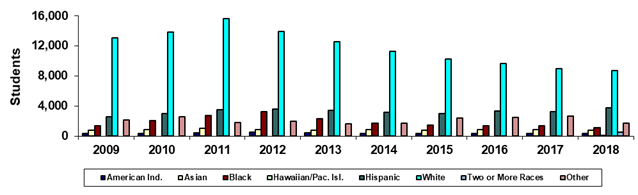
Rio Salado College |
|
Spring 45th Day Ethnicity |
|
|
|
|
|
|
|
|
|
|
|
|
|
|
Year |
2009 |
2010 |
2011 |
2012 |
2013 |
2014 |
2015 |
2016 |
2017 |
2018 |
|
American Ind. |
322 |
375 |
450 |
476 |
418 |
371 |
346 |
338 |
331 |
316 |
|
Asian |
759 |
840 |
1,069 |
870 |
798 |
841 |
812 |
867 |
881 |
758 |
|
Black |
1,381 |
2,036 |
2,743 |
3,247 |
2,273 |
1,692 |
1,449 |
1,373 |
1,363 |
1,116 |
|
Hawaiian/Pac. Isl. |
0 |
0 |
0 |
0 |
0 |
0 |
0 |
0 |
0 |
54 |
|
Hispanic |
2,604 |
2,991 |
3,514 |
3,606 |
3,377 |
3,151 |
3,007 |
3,301 |
3,242 |
3,779 |
|
White |
13,042 |
13,841 |
15,661 |
13,901 |
12,519 |
11,262 |
10,246 |
9,621 |
8,975 |
8,706 |
|
Two or More Races |
0 |
0 |
0 |
0 |
0 |
0 |
0 |
0 |
0 |
516 |
|
Other |
2,119 |
2,549 |
1,799 |
1,937 |
1,623 |
1,683 |
2,409 |
2,462 |
2,622 |
1,754 |
|
Total |
20,227 |
22,632 |
25,236 |
24,037 |
21,008 |
19,000 |
18,269 |
17,962 |
17,414 |
16,999 |
|
|
|
|
|
|
|
|
|
|
|
|
|
% American Ind. |
1.6% |
1.7% |
1.8% |
2.0% |
2.0% |
2.0% |
1.9% |
1.9% |
1.9% |
1.9% |
|
% Asian |
3.8% |
3.7% |
4.2% |
3.6% |
3.8% |
4.4% |
4.4% |
4.8% |
5.1% |
4.5% |
|
% Black |
6.8% |
9.0% |
10.9% |
13.5% |
10.8% |
8.9% |
7.9% |
7.6% |
7.8% |
6.6% |
|
% Hawaiian/Pac. Isl. |
0.0% |
0.0% |
0.0% |
0.0% |
0.0% |
0.0% |
0.0% |
0.0% |
0.0% |
0.3% |
|
% Hispanic |
12.9% |
13.2% |
13.9% |
15.0% |
16.1% |
16.6% |
16.5% |
18.4% |
18.6% |
22.2% |
|
% White |
64.5% |
61.2% |
62.1% |
57.8% |
59.6% |
59.3% |
56.1% |
53.6% |
51.5% |
51.2% |
|
% Two or More Races |
0.0% |
0.0% |
0.0% |
0.0% |
0.0% |
0.0% |
0.0% |
0.0% |
0.0% |
3.0% |
|
% Other |
10.5% |
11.3% |
7.1% |
8.1% |
7.7% |
8.9% |
13.2% |
13.7% |
15.1% |
10.3% |
|
|
|
|
|
|
|
|
|
|
|
|
|
Print in landscape for
best results |
|
|
|
|
|
Last updated on |
May 15, 2018 |
|
Note: A timing difference in data capture for
Spring 2015 resulted in 16 fewer students in this report than the official
number reported to the State. |
|
|
|
|
|
|
|
|
|
|
|
|
|
Source:
Official 45th Day headcount as reported by colleges. |
|
Maricopa Community College District • Office of
Institutional Effectiveness • Maricopa Trends |
|
https://asa.maricopa.edu/departments/institutional-effectiveness/data-and-projects/maricopa-trends |
|
|
|
|
*Beginning in Spring
2018, race-ethnicity categories changed to provide counts for
"Hawaiian/Pacific Islander" and "Two or more races." |
|
|
|
|
|
|
|
|
|
|
|
|