|
|
|
|
|
|
|
|
|
|
|
|
|
|
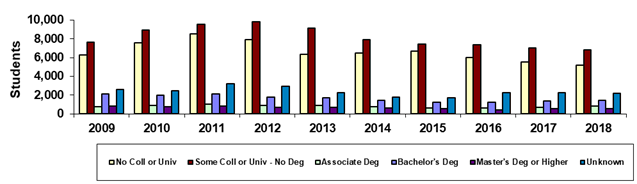
Rio Salado College |
|
|
Spring 45th Day Admission Status |
|
|
|
|
|
|
|
|
|
|
|
|
|
|
|
|
|
|
|
|
|
|
|
|
|
|
|
|
|
|
|
|
|
|
|
|
|
|
|
|
|
|
|
|
|
|
|
|
|
|
|
|
|
|
|
|
|
|
|
|
|
|
|
|
|
|
|
|
|
|
|
|
|
|
|
|
|
|
|
|
|
|
|
|
|
|
|
|
|
|
|
|
|
|
|
|
|
|
|
|
|
|
|
|
|
|
|
|
|
|
|
|
|
|
|
|
|
|
|
|
|
|
|
|
|
|
|
|
|
|
|
|
|
|
|
|
|
|
|
|
|
|
|
|
|
|
|
|
|
|
|
|
|
|
|
|
|
|
Year |
2009 |
2010 |
2011 |
2012 |
2013 |
2014 |
2015 |
2016 |
2017 |
2018 |
|
|
No Coll or Univ |
6,297 |
7,539 |
8,494 |
7,930 |
6,352 |
6,449 |
6,683 |
6,030 |
5,539 |
5,209 |
|
|
Some Coll or Univ - No Deg |
7,648 |
8,933 |
9,553 |
9,796 |
9,125 |
7,909 |
7,456 |
7,343 |
7,002 |
6,820 |
|
|
Associate Deg |
749 |
919 |
1,064 |
904 |
894 |
755 |
635 |
635 |
695 |
808 |
|
|
Bachelor's Deg |
2,099 |
2,002 |
2,103 |
1,764 |
1,721 |
1,433 |
1,224 |
1,256 |
1,399 |
1,432 |
|
|
Master's Deg or Higher |
837 |
751 |
810 |
682 |
668 |
642 |
558 |
453 |
533 |
550 |
|
|
Unknown |
2,597 |
2,488 |
3,212 |
2,961 |
2,248 |
1,812 |
1,713 |
2,245 |
2,246 |
2,180 |
|
|
Total |
20,227 |
22,632 |
25,236 |
24,037 |
21,008 |
19,000 |
18,269 |
17,962 |
17,414 |
16,999 |
|
|
|
|
|
|
|
|
|
|
|
|
|
|
|
|
|
|
|
|
|
|
|
|
|
|
|
|
% No Coll or Univ |
31.1% |
33.3% |
33.7% |
33.0% |
30.2% |
33.9% |
36.6% |
33.6% |
31.8% |
30.6% |
|
|
% Some Coll or Univ - No Deg |
37.8% |
39.5% |
37.9% |
40.8% |
43.4% |
41.6% |
40.8% |
40.9% |
40.2% |
40.1% |
|
|
% Associate Deg |
3.7% |
4.1% |
4.2% |
3.8% |
4.3% |
4.0% |
3.5% |
3.5% |
4.0% |
4.8% |
|
|
% Bachelor's Deg |
10.4% |
8.8% |
8.3% |
7.3% |
8.2% |
7.5% |
6.7% |
7.0% |
8.0% |
8.4% |
|
|
% Master's Deg or Higher |
4.1% |
3.3% |
3.2% |
2.8% |
3.2% |
3.4% |
3.1% |
2.5% |
3.1% |
3.2% |
|
|
% Unknown |
12.8% |
11.0% |
12.7% |
12.3% |
10.7% |
9.5% |
9.4% |
12.5% |
12.9% |
12.8% |
|
|
|
|
|
|
|
|
|
|
|
|
|
|
|
|
|
|
|
|
|
|
|
|
|
|
|
| |
Print in landscape for best results |
|
|
|
|
|
|
Last updated on |
May 15, 2018 |
|
| |
Note: A timing difference in data capture for
Spring 2015 resulted in 16 fewer students in this report than the official
number reported to the State. |
|
| |
|
|
|
|
|
|
|
|
|
|
|
|
| |
Source:
Official 45th Day headcount as reported by colleges. |
|
| |
Maricopa Community College District • Office of
Institutional Effectiveness • Maricopa Trends |
|
| |
https://asa.maricopa.edu/departments/institutional-effectiveness/data-and-projects/maricopa-trends |
|
|
|
|
|
|
|
|
|
|
|
|
|
|
|
|
|