|
|
|
|
|
|
|
|
|
|
|
|
|
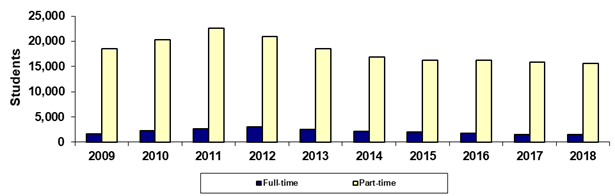
Rio Salado College |
|
Spring 45th Day Full-time vs Part-time |
|
|
|
|
|
|
|
|
|
|
|
|
|
|
Year |
2009 |
2010 |
2011 |
2012 |
2013 |
2014 |
2015 |
2016 |
2017 |
2018 |
|
Full-time |
1,692 |
2,317 |
2,619 |
3,094 |
2,481 |
2,095 |
1,971 |
1,700 |
1,544 |
1,459 |
|
Part-time |
18,535 |
20,315 |
22,617 |
20,943 |
18,527 |
16,905 |
16,298 |
16,262 |
15,870 |
15,540 |
|
Sum of Colleges* |
20,227 |
22,632 |
25,236 |
24,037 |
21,008 |
19,000 |
18,269 |
17,962 |
17,414 |
16,999 |
|
|
|
|
|
|
|
|
|
|
|
|
|
% Full-time |
8.4% |
10.2% |
10.4% |
12.9% |
11.8% |
11.0% |
10.8% |
9.5% |
8.9% |
8.6% |
|
% Part-time |
91.6% |
89.8% |
89.6% |
87.1% |
88.2% |
89.0% |
89.2% |
90.5% |
91.1% |
91.4% |
|
|
|
|
|
|
|
|
|
|
|
|
|
Print in landscape for
best results |
|
|
|
|
|
Last updated on |
May 15, 2018 |
|
Note: A timing difference in data capture for
Spring 2015 resulted in 16 fewer students in this report than the official
number reported to the State. |
|
|
|
|
|
|
|
|
|
|
|
|
|
Source:
Official 45th Day headcount as reported by colleges. |
|
Maricopa Community College District • Office of
Institutional Effectiveness • Maricopa Trends |
|
https://asa.maricopa.edu/departments/institutional-effectiveness/data-and-projects/maricopa-trends |
|
|
|
|
|
|
|
|
|
|
|
|
|
|
|
|
|
|
|
|
|
|
|
|
|
|
|
|
|
|
|
|
|
|
|
|
|
|
|
|
|
|
|
|
|
|
|
|
|
|
|
|
|
|
|
|
|
|
|
|
|
|
|
|
|
|
|
|
|
|
|
|
|
|
|
|
|
|
|
|
|
|
|
|
|
|
|
|
|
|
|
|
|
|
|
|
|
|
|
|
|
|
|
|
|
|
|
|
|
|
|
|
|
|
|
|
|
|
|
|
|
|
|
|
|
|
|
|
|
|
|
|
|
|
|
|
|
|
|
|
|
|
|
|
|
|
|
|
|
|
|
|
|
|
|
|
|
|
|
|
|
|
|
|
|
|
|
|
|
|