|
|
|
|
|
|
|
|
|
|
|
|
|
Rio Salado College |
|
Spring 45th Day Primary Time of Attendance
Headcount |
|
|
|
|
|
|
|
|
|
|
|
|
|
|
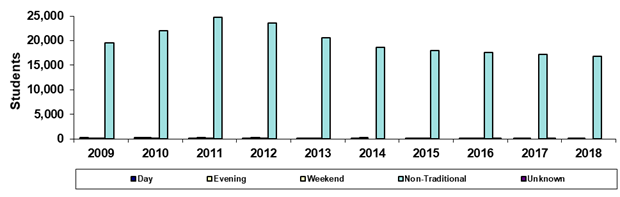
Year |
2009 |
2010 |
2011 |
2012 |
2013 |
2014 |
2015 |
2016 |
2017 |
2018 |
|
Day |
319 |
305 |
213 |
140 |
142 |
133 |
61 |
106 |
121 |
66 |
|
Evening |
214 |
221 |
237 |
231 |
217 |
233 |
173 |
187 |
104 |
137 |
|
Weekend |
123 |
44 |
97 |
53 |
10 |
0 |
12 |
11 |
0 |
0 |
|
Non-Traditional |
19,571 |
22,062 |
24,689 |
23,613 |
20,639 |
18,634 |
18,023 |
17,648 |
17,173 |
16,796 |
|
Unknown |
0 |
0 |
0 |
0 |
0 |
0 |
0 |
10 |
16 |
0 |
|
Total |
20,227 |
22,632 |
25,236 |
24,037 |
21,008 |
19,000 |
18,269 |
17,962 |
17,414 |
16,999 |
|
|
|
|
|
|
|
|
|
|
|
|
|
% Day |
1.6% |
1.3% |
0.8% |
0.6% |
0.7% |
0.7% |
0.3% |
0.6% |
0.7% |
0.4% |
|
% Evening |
1.1% |
1.0% |
0.9% |
1.0% |
1.0% |
1.2% |
0.9% |
1.0% |
0.6% |
0.8% |
|
%Weekend |
0.6% |
0.2% |
0.4% |
0.2% |
0.0% |
0.0% |
0.1% |
0.1% |
0.0% |
0.0% |
|
%Non-Traditional |
96.8% |
97.5% |
97.8% |
98.2% |
98.2% |
98.1% |
98.7% |
98.3% |
98.6% |
98.8% |
|
%Unknown |
0.0% |
0.0% |
0.0% |
0.0% |
0.0% |
0.0% |
0.0% |
0.1% |
0.1% |
0.0% |
|
|
|
|
|
|
|
|
|
|
|
|
|
Print in landscape for
best results |
|
|
|
|
|
Last updated on |
May 15, 2018 |
|
Note: A timing difference in data capture for
Spring 2015 resulted in 16 fewer students in this report than the official
number reported to the State. |
|
|
|
|
|
|
|
|
|
|
|
|
|
Source:
Official 45th Day headcount as reported by colleges. |
|
Maricopa Community College District • Office of
Institutional Effectiveness • Maricopa Trends |
|
https://asa.maricopa.edu/departments/institutional-effectiveness/data-and-projects/maricopa-trends |
|
|
|
|
|
|
|
|
|
|
|
|
|
|