|
|
|
|
|
|
|
|
|
|
|
|
|
|
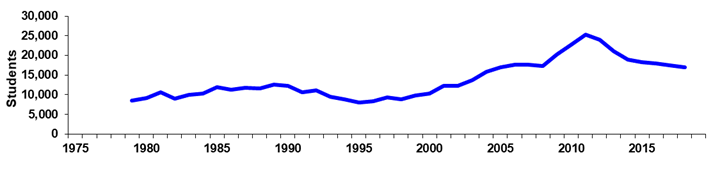
Rio Salado College |
|
|
Spring 45th Day Historical Headcount |
|
|
|
|
|
|
|
|
|
|
|
|
|
|
|
|
|
|
|
|
|
|
|
|
|
|
|
|
|
|
|
|
|
|
|
|
|
|
Year |
1970 |
1971 |
1972 |
1973 |
1974 |
1975 |
1976 |
1977 |
1978 |
1979 |
|
|
Day |
|
|
|
|
|
|
|
|
|
0 |
|
|
% Change |
|
|
|
|
|
|
|
|
|
0.0% |
|
|
Evening |
|
|
|
|
|
|
|
|
|
8,448 |
|
|
% Change |
|
|
|
|
|
|
|
|
|
0.0% |
|
|
Total |
|
|
|
|
|
|
|
|
|
8,448 |
|
|
% Change |
|
|
|
|
|
|
|
|
|
0.0% |
|
|
|
|
|
|
|
|
|
|
|
|
|
|
|
Year |
1980 |
1981 |
1982 |
1983 |
1984 |
1985 |
1986 |
1987 |
1988 |
1989 |
|
|
Day |
0 |
0 |
0 |
0 |
0 |
0 |
0 |
0 |
0 |
0 |
|
|
% Change |
0.0% |
0.0% |
0.0% |
0.0% |
0.0% |
0.0% |
0.0% |
0.0% |
0.0% |
0.0% |
|
|
Evening |
9,160 |
10,639 |
8,943 |
10,060 |
10,368 |
11,965 |
11,254 |
11,824 |
11,554 |
12,624 |
|
|
% Change |
8.4% |
16.1% |
-15.9% |
12.5% |
3.1% |
15.4% |
-5.9% |
5.1% |
-2.3% |
9.3% |
|
|
Total |
9,160 |
10,639 |
8,943 |
10,060 |
10,368 |
11,965 |
11,254 |
11,824 |
11,554 |
12,624 |
|
|
% Change |
8.4% |
16.1% |
-15.9% |
12.5% |
3.1% |
15.4% |
-5.9% |
5.1% |
-2.3% |
9.3% |
|
|
|
|
|
|
|
|
|
|
|
|
|
|
|
Year |
1990 |
1991 |
1992 |
1993 |
1994 |
1995 |
1996 |
1997 |
1998 |
1999 |
|
|
Day |
0 |
0 |
0 |
0 |
0 |
0 |
0 |
0 |
0 |
0 |
|
|
% Change |
0.0% |
0.0% |
0.0% |
0.0% |
0.0% |
0.0% |
0.0% |
0.0% |
0.0% |
0.0% |
|
|
Evening |
12,209 |
10,714 |
11,189 |
9,457 |
8,859 |
8,004 |
8,345 |
9,345 |
8,901 |
9,845 |
|
|
% Change |
-3.3% |
-12.2% |
4.4% |
-15.5% |
-6.3% |
-9.7% |
4.3% |
12.0% |
-4.8% |
10.6% |
|
|
Total |
12,209 |
10,714 |
11,189 |
9,457 |
8,859 |
8,004 |
8,345 |
9,345 |
8,901 |
9,845 |
|
|
% Change |
-3.3% |
-12.2% |
4.4% |
-15.5% |
-6.3% |
-9.7% |
4.3% |
12.0% |
-4.8% |
10.6% |
|
|
|
|
|
|
|
|
|
|
|
|
|
|
|
Year |
2000 |
2001 |
2002 |
2003 |
2004 |
2005 |
2006 |
2007 |
2008 |
2009 |
|
|
Day |
4,415 |
5,541 |
4,680 |
5,254 |
6,494 |
6,647 |
7,294 |
7,036 |
0 |
0 |
|
|
% Change |
0.0% |
25.5% |
-15.5% |
12.3% |
23.6% |
2.4% |
9.7% |
-3.5% |
0.0% |
0.0% |
|
|
Evening |
5,938 |
6,770 |
7,550 |
8,502 |
9,355 |
10,295 |
10,364 |
10,671 |
0 |
0 |
|
|
% Change |
-39.7% |
14.0% |
11.5% |
12.6% |
10.0% |
10.0% |
0.7% |
3.0% |
0.0% |
0.0% |
|
|
Total |
10,353 |
12,311 |
12,230 |
13,756 |
15,849 |
16,942 |
17,658 |
17,707 |
17,375 |
20,227 |
|
|
% Change |
5.2% |
18.9% |
-0.7% |
12.5% |
15.2% |
6.9% |
4.2% |
0.3% |
-1.9% |
16.4% |
|
|
|
|
|
|
|
|
|
|
|
|
|
|
|
Year |
2010 |
2011 |
2012 |
2013 |
2014 |
2015 |
2016 |
2017 |
2018 |
|
|
|
Day |
0 |
|
|
|
|
|
|
|
|
|
|
|
% Change |
0.0% |
|
|
|
|
|
|
|
|
|
|
|
Evening |
0 |
|
|
|
|
|
|
|
|
|
|
|
% Change |
0.0% |
|
|
|
|
|
|
|
|
|
|
|
Total |
22,632 |
25,236 |
24,037 |
21,008 |
19,000 |
18,269 |
17,962 |
17,414 |
16,999 |
|
|
|
% Change |
11.9% |
11.5% |
-4.8% |
-12.6% |
-9.6% |
-3.8% |
-1.7% |
-3.1% |
-2.4% |
|
|
|
|
|
|
|
|
|
|
|
|
|
|
|
|
|
|
|
|
|
|
|
|
|
|
|
|
|
Print in landscape for
best results |
|
|
|
|
|
Last updated on |
May 15, 2018 |
|
|
Note: A timing difference in data capture for
Spring 2015 resulted in 16 fewer students in this report than the official
number reported to the State. |
|
|
Source:
Official 45th Day headcount as reported by colleges. |
|
|
Maricopa Community College District • Office of
Institutional Effectiveness • Maricopa Trends |
|
|
https://asa.maricopa.edu/departments/institutional-effectiveness/data-and-projects/maricopa-trends |
|
|
|
|
|
|
|
|
|
|
|
|
|
|
|
|
|
|