|
|
|
|
|
|
|
|
|
|
|
|
|
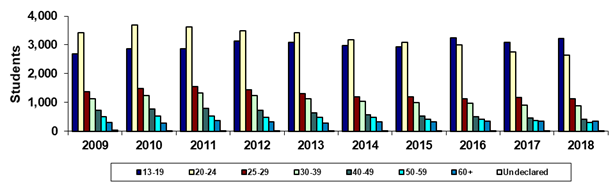
Scottsdale Community College |
|
Spring 45th Day Age Groups |
|
|
|
|
|
|
|
|
|
|
|
|
|
|
|
|
|
|
|
|
|
|
|
|
|
Year |
2009 |
2010 |
2011 |
2012 |
2013 |
2014 |
2015 |
2016 |
2017 |
2018 |
|
13-19 |
2,686 |
2,855 |
2,868 |
3,127 |
3,087 |
2,968 |
2,938 |
3,251 |
3,094 |
3,224 |
|
20-24 |
3,415 |
3,694 |
3,626 |
3,482 |
3,422 |
3,181 |
3,093 |
2,992 |
2,762 |
2,650 |
|
25-29 |
1,379 |
1,483 |
1,543 |
1,431 |
1,317 |
1,192 |
1,200 |
1,131 |
1,175 |
1,134 |
|
30-39 |
1,135 |
1,242 |
1,322 |
1,246 |
1,128 |
1,041 |
1,005 |
971 |
914 |
890 |
|
40-49 |
719 |
763 |
798 |
725 |
640 |
565 |
517 |
504 |
463 |
417 |
|
50-59 |
508 |
522 |
534 |
492 |
492 |
473 |
420 |
408 |
364 |
311 |
|
60+ |
296 |
289 |
363 |
324 |
288 |
333 |
320 |
340 |
350 |
342 |
|
Undeclared |
28 |
20 |
11 |
6 |
10 |
9 |
5 |
7 |
7 |
5 |
|
Total |
10,166 |
10,868 |
11,065 |
10,833 |
10,384 |
9,762 |
9,498 |
9,604 |
9,129 |
8,973 |
|
|
|
|
|
|
|
|
|
|
|
|
|
% 13-19 |
26.4% |
26.3% |
25.9% |
28.9% |
29.7% |
30.4% |
30.9% |
33.9% |
33.9% |
35.9% |
|
% 20-24 |
33.6% |
34.0% |
32.8% |
32.1% |
33.0% |
32.6% |
32.6% |
31.2% |
30.3% |
29.5% |
|
% 25-29 |
13.6% |
13.6% |
13.9% |
13.2% |
12.7% |
12.2% |
12.6% |
11.8% |
12.9% |
12.6% |
|
% 30-39 |
11.2% |
11.4% |
11.9% |
11.5% |
10.9% |
10.7% |
10.6% |
10.1% |
10.0% |
9.9% |
|
% 40-49 |
7.1% |
7.0% |
7.2% |
6.7% |
6.2% |
5.8% |
5.4% |
5.2% |
5.1% |
4.6% |
|
% 50-59 |
5.0% |
4.8% |
4.8% |
4.5% |
4.7% |
4.8% |
4.4% |
4.2% |
4.0% |
3.5% |
|
% 60+ |
2.9% |
2.7% |
3.3% |
3.0% |
2.8% |
3.4% |
3.4% |
3.5% |
3.8% |
3.8% |
|
% Undeclared |
0.3% |
0.2% |
0.1% |
0.1% |
0.1% |
0.1% |
0.1% |
0.1% |
0.1% |
0.1% |
|
|
|
|
|
|
|
|
|
|
|
|
|
Print in landscape for
best results |
|
|
|
|
|
Last updated on |
May 15, 2018 |
|
Source:
Official 45th Day headcount as reported by colleges. |
|
Maricopa Community College District • Office of
Institutional Effectiveness • Maricopa Trends |
|
https://asa.maricopa.edu/departments/institutional-effectiveness/data-and-projects/maricopa-trends |
|
|
|
|
|
|
|
|
|
|
|
|
|
|