|
|
|
|
|
|
|
|
|
|
|
|
|
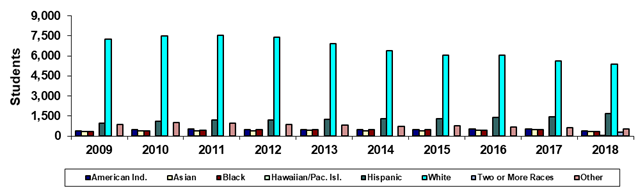
Scottsdale Community College |
|
Spring 45th Day Ethnicity |
|
|
|
|
|
|
|
|
|
|
|
|
|
|
Year |
2009 |
2010 |
2011 |
2012 |
2013 |
2014 |
2015 |
2016 |
2017 |
2018 |
|
American Ind. |
411 |
499 |
536 |
504 |
484 |
475 |
506 |
555 |
515 |
411 |
|
Asian |
340 |
386 |
396 |
399 |
420 |
404 |
394 |
448 |
460 |
324 |
|
Black |
325 |
392 |
425 |
468 |
475 |
484 |
477 |
450 |
475 |
356 |
|
Hawaiian/Pac. Isl. |
0 |
0 |
0 |
0 |
0 |
0 |
0 |
0 |
0 |
29 |
|
Hispanic |
977 |
1,088 |
1,205 |
1,201 |
1,262 |
1,279 |
1,299 |
1,389 |
1,432 |
1,669 |
|
White |
7,257 |
7,506 |
7,540 |
7,402 |
6,908 |
6,408 |
6,041 |
6,068 |
5,604 |
5,365 |
|
Two or More Races |
0 |
0 |
0 |
0 |
0 |
0 |
0 |
0 |
0 |
307 |
|
Other |
856 |
997 |
963 |
859 |
835 |
712 |
781 |
694 |
643 |
512 |
|
Total |
10,166 |
10,868 |
11,065 |
10,833 |
10,384 |
9,762 |
9,498 |
9,604 |
9,129 |
8,973 |
|
|
|
|
|
|
|
|
|
|
|
|
|
% American Ind. |
4.0% |
4.6% |
4.8% |
4.7% |
4.7% |
4.9% |
5.3% |
5.8% |
5.6% |
4.6% |
|
% Asian |
3.3% |
3.6% |
3.6% |
3.7% |
4.0% |
4.1% |
4.1% |
4.7% |
5.0% |
3.6% |
|
% Black |
3.2% |
3.6% |
3.8% |
4.3% |
4.6% |
5.0% |
5.0% |
4.7% |
5.2% |
4.0% |
|
% Hawaiian/Pac. Isl. |
0.0% |
0.0% |
0.0% |
0.0% |
0.0% |
0.0% |
0.0% |
0.0% |
0.0% |
0.3% |
|
% Hispanic |
9.6% |
10.0% |
10.9% |
11.1% |
12.2% |
13.1% |
13.7% |
14.5% |
15.7% |
18.6% |
|
% White |
71.4% |
69.1% |
68.1% |
68.3% |
66.5% |
65.6% |
63.6% |
63.2% |
61.4% |
59.8% |
|
% Two or More Races |
0.0% |
0.0% |
0.0% |
0.0% |
0.0% |
0.0% |
0.0% |
0.0% |
0.0% |
3.4% |
|
% Other |
8.4% |
9.2% |
8.7% |
7.9% |
8.0% |
7.3% |
8.2% |
7.2% |
7.0% |
5.7% |
|
|
|
|
|
|
|
|
|
|
|
|
|
Print in landscape for
best results |
|
|
|
|
|
Last updated on |
May 15, 2018 |
|
Source:
Official 45th Day headcount as reported by colleges. |
|
Maricopa Community College District • Office of
Institutional Effectiveness • Maricopa Trends |
|
https://asa.maricopa.edu/departments/institutional-effectiveness/data-and-projects/maricopa-trends |
|
|
|
|
*Beginning in Spring
2018, race-ethnicity categories changed to provide counts for
"Hawaiian/Pacific Islander" and "Two or more races." |
|
|
|
|
|
|
|
|
|
|
|
|