|
|
|
|
|
|
|
|
|
|
|
|
|
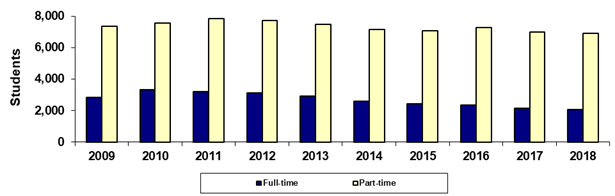
Scottsdale Community College |
|
Spring 45th Day Full-time vs Part-time |
|
|
|
|
|
|
|
|
|
|
|
|
|
|
Year |
2009 |
2010 |
2011 |
2012 |
2013 |
2014 |
2015 |
2016 |
2017 |
2018 |
|
Full-time |
2,824 |
3,318 |
3,214 |
3,106 |
2,907 |
2,609 |
2,429 |
2,333 |
2,152 |
2,076 |
|
Part-time |
7,342 |
7,550 |
7,851 |
7,727 |
7,477 |
7,153 |
7,069 |
7,271 |
6,977 |
6,897 |
|
Sum of Colleges* |
10,166 |
10,868 |
11,065 |
10,833 |
10,384 |
9,762 |
9,498 |
9,604 |
9,129 |
8,973 |
|
|
|
|
|
|
|
|
|
|
|
|
|
% Full-time |
27.8% |
30.5% |
29.0% |
28.7% |
28.0% |
26.7% |
25.6% |
24.3% |
23.6% |
23.1% |
|
% Part-time |
72.2% |
69.5% |
71.0% |
71.3% |
72.0% |
73.3% |
74.4% |
75.7% |
76.4% |
76.9% |
|
|
|
|
|
|
|
|
|
|
|
|
|
Print in landscape for best results |
Last updated on |
May 15, 2018 |
|
Source:
Official 45th Day headcount as reported by colleges. |
|
Maricopa Community College District • Office of
Institutional Effectiveness • Maricopa Trends |
|
https://asa.maricopa.edu/departments/institutional-effectiveness/data-and-projects/maricopa-trends |
|
|
|
|
|
|
|
|
|
|
|
|
|
|
|
|
|
|
|
|
|
|
|
|
|
|
|
|
|
|
|
|
|
|
|
|
|
|
|
|
|
|
|
|
|
|
|
|
|
|
|
|
|
|
|
|
|
|
|
|
|
|
|
|
|
|
|
|
|
|
|
|
|
|
|
|
|
|
|
|
|
|
|
|
|
|
|
|
|
|
|
|
|
|
|
|
|
|
|
|
|
|
|
|
|
|
|
|
|
|
|
|
|
|
|
|
|
|
|
|
|
|
|
|
|
|
|
|
|
|
|
|
|
|
|
|
|
|
|
|
|
|
|
|
|
|
|
|
|
|
|
|
|
|
|
|
|
|
|
|
|
|
|
|
|
|
|
|
|
|