|
|
|
|
|
|
|
|
|
|
|
|
|
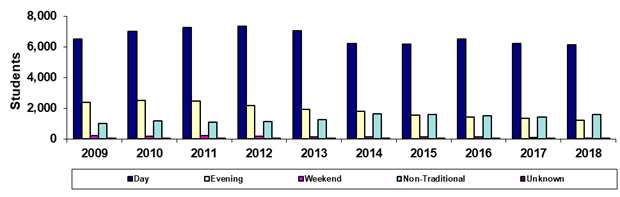
Scottsdale Community College |
|
Spring 45th Day Primary Time of Attendance
Headcount |
|
|
|
|
|
|
|
|
|
|
|
|
|
|
Year |
2009 |
2010 |
2011 |
2012 |
2013 |
2014 |
2015 |
2016 |
2017 |
2018 |
|
Day |
6,521 |
7,002 |
7,254 |
7,325 |
7,048 |
6,206 |
6,168 |
6,486 |
6,197 |
6,111 |
|
Evening |
2,390 |
2,490 |
2,470 |
2,175 |
1,904 |
1,779 |
1,566 |
1,427 |
1,357 |
1,217 |
|
Weekend |
222 |
194 |
210 |
195 |
149 |
121 |
125 |
117 |
111 |
54 |
|
Non-Traditional |
1,021 |
1,161 |
1,105 |
1,118 |
1,257 |
1,629 |
1,606 |
1,518 |
1,441 |
1,575 |
|
Unknown |
12 |
21 |
26 |
20 |
26 |
27 |
33 |
56 |
23 |
16 |
|
Total |
10,166 |
10,868 |
11,065 |
10,833 |
10,384 |
9,762 |
9,498 |
9,604 |
9,129 |
8,973 |
|
|
|
|
|
|
|
|
|
|
|
|
|
% Day |
64.1% |
64.4% |
65.6% |
67.6% |
67.9% |
63.6% |
64.9% |
67.5% |
67.9% |
68.1% |
|
% Evening |
23.5% |
22.9% |
22.3% |
20.1% |
18.3% |
18.2% |
16.5% |
14.9% |
14.9% |
13.6% |
|
%Weekend |
2.2% |
1.8% |
1.9% |
1.8% |
1.4% |
1.2% |
1.3% |
1.2% |
1.2% |
0.6% |
|
%Non-Traditional |
10.0% |
10.7% |
10.0% |
10.3% |
12.1% |
16.7% |
16.9% |
15.8% |
15.8% |
17.6% |
|
%Unknown |
0.1% |
0.2% |
0.2% |
0.2% |
0.3% |
0.3% |
0.3% |
0.6% |
0.3% |
0.2% |
|
|
|
|
|
|
|
|
|
|
|
|
|
Print in landscape for best results |
Last updated on |
May 15, 2018 |
|
Source:
Official 45th Day headcount as reported by colleges. |
|
Maricopa Community College District • Office of
Institutional Effectiveness • Maricopa Trends |
|
https://asa.maricopa.edu/departments/institutional-effectiveness/data-and-projects/maricopa-trends |
|
|
|
|
|
|
|
|
|
|
|
|
|
|