|
|
|
|
|
|
|
|
|
|
|
|
|
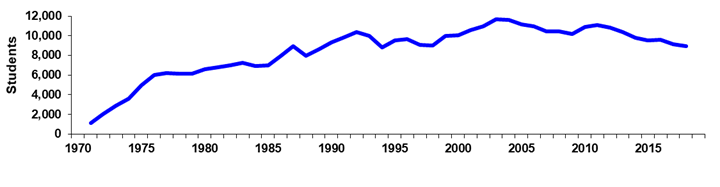
Scottsdale Community College |
|
Spring 45th Day Historical Headcount |
|
|
|
|
|
|
|
|
|
|
|
|
|
|
|
|
|
|
|
|
|
|
|
|
|
Year |
1970 |
1971 |
1972 |
1973 |
1974 |
1975 |
1976 |
1977 |
1978 |
1979 |
|
Day |
|
588 |
1,148 |
1,700 |
1,972 |
2,988 |
3,459 |
3,132 |
3,195 |
3,232 |
|
% Change |
|
0.0% |
95.2% |
48.1% |
16.0% |
51.5% |
15.8% |
-9.5% |
2.0% |
1.2% |
|
Evening |
|
520 |
863 |
1,164 |
1,611 |
2,003 |
2,559 |
3,081 |
2,956 |
2,931 |
|
% Change |
|
0.0% |
66.0% |
34.9% |
38.4% |
24.3% |
27.8% |
20.4% |
-4.1% |
-0.8% |
|
Total |
|
1,108 |
2,011 |
2,864 |
3,583 |
4,991 |
6,018 |
6,213 |
6,151 |
6,163 |
|
% Change |
|
0.0% |
81.5% |
42.4% |
25.1% |
39.3% |
20.6% |
3.2% |
-1.0% |
0.2% |
|
|
|
|
|
|
|
|
|
|
|
|
|
Year |
1980 |
1981 |
1982 |
1983 |
1984 |
1985 |
1986 |
1987 |
1988 |
1989 |
|
Day |
3,473 |
3,825 |
4,056 |
4,295 |
4,131 |
4,108 |
4,659 |
5,108 |
4,670 |
4,897 |
|
% Change |
7.5% |
10.1% |
6.0% |
5.9% |
-3.8% |
-0.6% |
13.4% |
9.6% |
-8.6% |
4.9% |
|
Evening |
3,103 |
2,962 |
2,905 |
2,925 |
2,782 |
2,879 |
3,280 |
3,853 |
3,291 |
3,750 |
|
% Change |
5.9% |
-4.5% |
-1.9% |
0.7% |
-4.9% |
3.5% |
13.9% |
17.5% |
-14.6% |
13.9% |
|
Total |
6,576 |
6,787 |
6,961 |
7,220 |
6,913 |
6,987 |
7,939 |
8,961 |
7,961 |
8,647 |
|
% Change |
6.7% |
3.2% |
2.6% |
3.7% |
-4.3% |
1.1% |
13.6% |
12.9% |
-11.2% |
8.6% |
|
|
|
|
|
|
|
|
|
|
|
|
|
Year |
1990 |
1991 |
1992 |
1993 |
1994 |
1995 |
1996 |
1997 |
1998 |
1999 |
|
Day |
5,544 |
5,831 |
6,109 |
5,990 |
5,490 |
5,756 |
5,665 |
5,477 |
5,336 |
5,928 |
|
% Change |
13.2% |
5.2% |
4.8% |
-1.9% |
-8.3% |
4.8% |
-1.6% |
-3.3% |
-2.6% |
11.1% |
|
Evening |
3,818 |
4,049 |
4,234 |
3,973 |
3,314 |
3,798 |
3,984 |
3,603 |
3,678 |
4,022 |
|
% Change |
1.8% |
6.1% |
4.6% |
-6.2% |
-16.6% |
14.6% |
4.9% |
-9.6% |
2.1% |
9.4% |
|
Total |
9,362 |
9,880 |
10,343 |
9,963 |
8,804 |
9,554 |
9,649 |
9,080 |
9,014 |
9,950 |
|
% Change |
8.3% |
5.5% |
4.7% |
-3.7% |
-11.6% |
8.5% |
1.0% |
-5.9% |
-0.7% |
10.4% |
|
|
|
|
|
|
|
|
|
|
|
|
|
Year |
2000 |
2001 |
2002 |
2003 |
2004 |
2005 |
2006 |
2007 |
2008 |
2009 |
|
Day |
5,924 |
6,286 |
6,643 |
7,011 |
6,989 |
7,027 |
7,137 |
7,242 |
0 |
0 |
|
% Change |
-0.1% |
6.1% |
5.7% |
5.5% |
-0.3% |
0.5% |
1.6% |
1.5% |
0.0% |
0.0% |
|
Evening |
4,134 |
4,273 |
4,289 |
4,639 |
4,594 |
4,118 |
3,820 |
3,208 |
0 |
0 |
|
% Change |
2.8% |
3.4% |
0.4% |
8.2% |
-1.0% |
-10.4% |
-7.2% |
-16.0% |
0.0% |
0.0% |
|
Total |
10,058 |
10,559 |
10,932 |
11,650 |
11,583 |
11,145 |
10,957 |
10,450 |
10,417 |
10,166 |
|
% Change |
1.1% |
5.0% |
3.5% |
6.6% |
-0.6% |
-3.8% |
-1.7% |
-4.6% |
-0.3% |
-2.4% |
|
|
|
|
|
|
|
|
|
|
|
|
|
Year |
2010 |
2011 |
2012 |
2013 |
2014 |
2015 |
2016 |
2017 |
2018 |
|
|
Day |
0 |
|
|
|
|
|
|
|
|
|
|
% Change |
0.0% |
|
|
|
|
|
|
|
|
|
|
Evening |
0 |
|
|
|
|
|
|
|
|
|
|
% Change |
0.0% |
|
|
|
|
|
|
|
|
|
|
Total |
10,868 |
11,065 |
10,833 |
10,384 |
9,762 |
9,498 |
9,604 |
9,129 |
8,973 |
|
|
% Change |
6.9% |
1.8% |
-2.1% |
-4.1% |
-6.0% |
-2.7% |
1.1% |
-4.9% |
-1.7% |
|
|
|
|
|
|
|
|
|
|
|
|
|
|
|
|
|
|
|
|
|
|
|
|
|
|
Print in landscape for
best results |
|
|
|
|
|
Last updated on |
May 15, 2018 |
|
Source:
Official 45th Day headcount as reported by colleges. |
|
Maricopa Community College District • Office of
Institutional Effectiveness • Maricopa Trends |
|
https://asa.maricopa.edu/departments/institutional-effectiveness/data-and-projects/maricopa-trends |
|
|
|
|
|
|
|
|
|
|
|
|
|
|
|
|