|
|
|
|
|
|
|
|
|
|
|
|
|
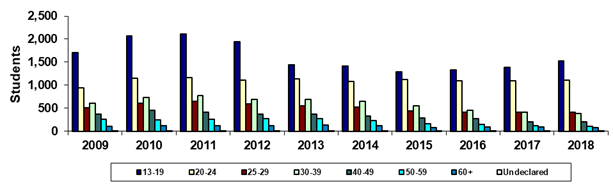
South Mountain Community College |
|
Spring 45th Day Age Groups |
|
|
|
|
|
|
|
|
|
|
|
|
|
|
|
|
|
|
|
|
|
|
|
|
|
Year |
2009 |
2010 |
2011 |
2012 |
2013 |
2014 |
2015 |
2016 |
2017 |
2018 |
|
13-19 |
1,703 |
2,064 |
2,114 |
1,948 |
1,439 |
1,415 |
1,294 |
1,326 |
1,392 |
1,530 |
|
20-24 |
946 |
1,154 |
1,171 |
1,111 |
1,133 |
1,082 |
1,125 |
1,094 |
1,094 |
1,109 |
|
25-29 |
513 |
603 |
655 |
589 |
554 |
519 |
447 |
417 |
418 |
407 |
|
30-39 |
602 |
728 |
770 |
686 |
687 |
654 |
554 |
457 |
411 |
385 |
|
40-49 |
375 |
460 |
417 |
376 |
378 |
335 |
288 |
279 |
201 |
202 |
|
50-59 |
260 |
253 |
264 |
279 |
274 |
236 |
168 |
147 |
120 |
107 |
|
60+ |
113 |
125 |
127 |
118 |
132 |
119 |
81 |
91 |
92 |
78 |
|
Undeclared |
11 |
13 |
10 |
6 |
3 |
4 |
2 |
1 |
2 |
1 |
|
Total |
4,523 |
5,400 |
5,528 |
5,113 |
4,600 |
4,364 |
3,959 |
3,812 |
3,730 |
3,819 |
|
|
|
|
|
|
|
|
|
|
|
|
|
% 13-19 |
37.7% |
38.2% |
38.2% |
38.1% |
31.3% |
32.4% |
32.7% |
34.8% |
37.3% |
40.1% |
|
% 20-24 |
20.9% |
21.4% |
21.2% |
21.7% |
24.6% |
24.8% |
28.4% |
28.7% |
29.3% |
29.0% |
|
% 25-29 |
11.3% |
11.2% |
11.8% |
11.5% |
12.0% |
11.9% |
11.3% |
10.9% |
11.2% |
10.7% |
|
% 30-39 |
13.3% |
13.5% |
13.9% |
13.4% |
14.9% |
15.0% |
14.0% |
12.0% |
11.0% |
10.1% |
|
% 40-49 |
8.3% |
8.5% |
7.5% |
7.4% |
8.2% |
7.7% |
7.3% |
7.3% |
5.4% |
5.3% |
|
% 50-59 |
5.7% |
4.7% |
4.8% |
5.5% |
6.0% |
5.4% |
4.2% |
3.9% |
3.2% |
2.8% |
|
% 60+ |
2.5% |
2.3% |
2.3% |
2.3% |
2.9% |
2.7% |
2.0% |
2.4% |
2.5% |
2.0% |
|
% Undeclared |
0.2% |
0.2% |
0.2% |
0.1% |
0.1% |
0.1% |
0.1% |
0.0% |
0.1% |
0.0% |
|
|
|
|
|
|
|
|
|
|
|
|
|
Print in landscape for
best results |
|
|
|
|
|
Last updated on |
May 15, 2018 |
|
Source:
Official 45th Day headcount as reported by colleges. |
|
Maricopa Community College District • Office of
Institutional Effectiveness • Maricopa Trends • Maricopa Trends |
|
https://asa.maricopa.edu/departments/institutional-effectiveness/data-and-projects/maricopa-trends |
|
|
|
|
|
|
|
|
|
|
|
|