|
|
|
|
|
|
|
|
|
|
|
|
|
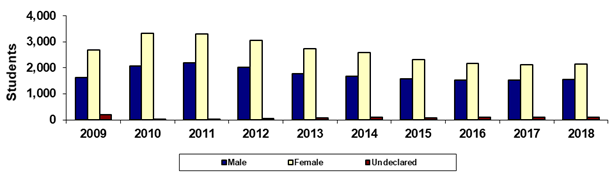
South Mountain Community College |
|
Spring 45th Day Gender |
|
|
|
|
|
|
|
|
|
|
|
|
|
|
|
|
|
|
|
|
|
|
|
|
|
Year |
2009 |
2010 |
2011 |
2012 |
2013 |
2014 |
2015 |
2016 |
2017 |
2018 |
|
Male |
1,629 |
2,067 |
2,186 |
2,015 |
1,779 |
1,675 |
1,571 |
1,540 |
1,529 |
1,552 |
|
Female |
2,684 |
3,330 |
3,311 |
3,053 |
2,742 |
2,597 |
2,309 |
2,175 |
2,108 |
2,155 |
|
Undeclared |
210 |
3 |
31 |
45 |
79 |
92 |
79 |
97 |
93 |
112 |
|
Total |
4,523 |
5,400 |
5,528 |
5,113 |
4,600 |
4,364 |
3,959 |
3,812 |
3,730 |
3,819 |
|
|
|
% Male |
36.0% |
38.3% |
39.5% |
39.4% |
38.7% |
38.4% |
39.7% |
40.4% |
41.0% |
40.6% |
|
% Female |
59.3% |
61.7% |
59.9% |
59.7% |
59.6% |
59.5% |
58.3% |
57.1% |
56.5% |
56.4% |
|
% Undeclared |
4.6% |
0.1% |
0.6% |
0.9% |
1.7% |
2.1% |
2.0% |
2.5% |
2.5% |
2.9% |
|
|
|
|
|
|
|
|
|
|
|
|
|
Print in landscape for best results |
Last updated on |
May 15, 2018 |
|
Source:
Official 45th Day headcount as reported by colleges. |
|
Maricopa Community College District • Office of
Institutional Effectiveness • Maricopa Trends |
|
https://asa.maricopa.edu/departments/institutional-effectiveness/data-and-projects/maricopa-trends |
|
|
|
|
|
|
|
|
|
|
|
|
|
|