|
|
|
|
|
|
|
|
|
|
|
|
|
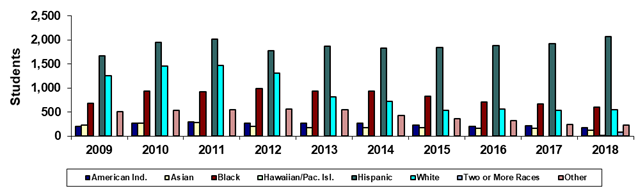
South Mountain Community College |
|
Spring 45th Day Ethnicity |
|
|
|
|
|
|
|
|
|
|
|
|
|
|
Year |
2009 |
2010 |
2011 |
2012 |
2013 |
2014 |
2015 |
2016 |
2017 |
2018 |
|
American Ind. |
195 |
270 |
300 |
274 |
266 |
268 |
224 |
203 |
215 |
177 |
|
Asian |
232 |
262 |
278 |
206 |
178 |
175 |
169 |
155 |
158 |
119 |
|
Black |
679 |
930 |
927 |
983 |
933 |
930 |
831 |
706 |
670 |
598 |
|
Hawaiian/Pac. Isl. |
0 |
0 |
0 |
0 |
0 |
0 |
0 |
0 |
0 |
10 |
|
Hispanic |
1,662 |
1,951 |
2,010 |
1,778 |
1,866 |
1,833 |
1,839 |
1,875 |
1,917 |
2,066 |
|
White |
1,253 |
1,448 |
1,462 |
1,312 |
812 |
725 |
534 |
558 |
530 |
541 |
|
Two or More Races |
0 |
0 |
0 |
0 |
0 |
0 |
0 |
0 |
0 |
79 |
|
Other |
502 |
539 |
551 |
560 |
545 |
433 |
362 |
315 |
240 |
229 |
|
Total |
4,523 |
5,400 |
5,528 |
5,113 |
4,600 |
4,364 |
3,959 |
3,812 |
3,730 |
3,819 |
|
|
|
|
|
|
|
|
|
|
|
|
|
% American Ind. |
4.3% |
5.0% |
5.4% |
5.4% |
5.8% |
6.1% |
5.7% |
5.3% |
5.8% |
4.6% |
|
% Asian |
5.1% |
4.9% |
5.0% |
4.0% |
3.9% |
4.0% |
4.3% |
4.1% |
4.2% |
3.1% |
|
% Black |
15.0% |
17.2% |
16.8% |
19.2% |
20.3% |
21.3% |
21.0% |
18.5% |
18.0% |
15.7% |
|
% Hawaiian/Pac. Isl. |
0.0% |
0.0% |
0.0% |
0.0% |
0.0% |
0.0% |
0.0% |
0.0% |
0.0% |
0.3% |
|
% Hispanic |
36.7% |
36.1% |
36.4% |
34.8% |
40.6% |
42.0% |
46.5% |
49.2% |
51.4% |
54.1% |
|
% White |
27.7% |
26.8% |
26.4% |
25.7% |
17.7% |
16.6% |
13.5% |
14.6% |
14.2% |
14.2% |
|
% Two or More Races |
0.0% |
0.0% |
0.0% |
0.0% |
0.0% |
0.0% |
0.0% |
0.0% |
0.0% |
2.1% |
|
% Other |
11.1% |
10.0% |
10.0% |
11.0% |
11.8% |
9.9% |
9.1% |
8.3% |
6.4% |
6.0% |
|
|
|
|
|
|
|
|
|
|
|
|
|
Print in landscape for best results |
Last updated on |
May 15, 2018 |
|
Source:
Official 45th Day headcount as reported by colleges. |
|
Maricopa Community College District • Office of
Institutional Effectiveness • Maricopa Trends |
|
https://asa.maricopa.edu/departments/institutional-effectiveness/data-and-projects/maricopa-trends |
|
|
|
|
*Beginning in Spring
2018, race-ethnicity categories changed to provide counts for
"Hawaiian/Pacific Islander" and "Two or more races." |
|
|
|
|
|
|
|
|
|
|
|
|