|
|
|
|
|
|
|
|
|
|
|
|
|
South Mountain Community College |
|
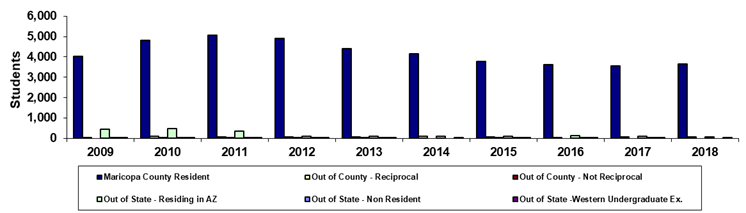
| Spring 45th Day Residency |
|
|
|
|
|
|
|
|
|
|
|
|
|
|
|
|
|
|
|
|
|
|
|
|
|
|
|
|
|
|
|
|
|
|
|
|
|
|
|
|
|
|
|
|
|
|
|
|
|
|
|
|
|
|
|
|
|
|
|
|
|
|
|
|
|
|
|
|
|
|
|
|
|
|
|
|
|
|
|
|
|
|
|
|
|
|
|
|
|
|
|
|
|
|
|
|
|
|
|
|
|
|
|
|
|
|
|
|
|
|
|
|
|
|
|
|
|
|
|
|
|
|
|
|
|
|
|
|
|
|
|
|
|
|
|
|
|
|
|
|
|
|
|
|
|
|
Year |
2009 |
2010 |
2011 |
2012 |
2013 |
2014 |
2015 |
2016 |
2017 |
2018 |
|
Maricopa County Resident |
4,017 |
4,807 |
5,082 |
4,915 |
4,402 |
4,152 |
3,773 |
3,636 |
3,551 |
3,651 |
|
Out of County - Reciprocal |
41 |
95 |
77 |
74 |
73 |
89 |
65 |
43 |
53 |
66 |
|
Out of County - Not Reciprocal |
0 |
1 |
2 |
1 |
1 |
0 |
1 |
0 |
0 |
0 |
|
Out of State - Residing in AZ |
449 |
482 |
352 |
108 |
105 |
107 |
104 |
116 |
98 |
78 |
|
Out of State - Non Resident |
3 |
3 |
1 |
5 |
3 |
0 |
3 |
3 |
4 |
0 |
|
Out of State -Western Undergraduate Ex. |
13 |
12 |
14 |
10 |
16 |
16 |
13 |
14 |
24 |
24 |
|
Total |
4,523 |
5,400 |
5,528 |
5,113 |
4,600 |
4,364 |
3,959 |
3,812 |
3,730 |
3,819 |
|
|
|
|
|
|
|
|
|
|
|
|
|
%Maricopa County Resident |
88.8% |
89.0% |
91.9% |
96.1% |
95.7% |
95.1% |
95.3% |
95.4% |
95.2% |
95.6% |
|
%Out of County - Reciprocal |
0.9% |
1.8% |
1.4% |
1.4% |
1.6% |
2.0% |
1.6% |
1.1% |
1.4% |
1.7% |
|
%Out of County - Not Reciprocal |
0.0% |
0.0% |
0.0% |
0.0% |
0.0% |
0.0% |
0.0% |
0.0% |
0.0% |
0.0% |
|
%Out of State - Residing in AZ |
9.9% |
8.9% |
6.4% |
2.1% |
2.3% |
2.5% |
2.6% |
3.0% |
2.6% |
2.0% |
|
%Out of State - Non Resident |
0.1% |
0.1% |
0.0% |
0.1% |
0.1% |
0.0% |
0.1% |
0.1% |
0.1% |
0.0% |
|
%Out of State -Western Undergraduate Ex. |
0.3% |
0.2% |
0.3% |
0.2% |
0.3% |
0.4% |
0.3% |
0.4% |
0.6% |
0.6% |
|
|
|
|
|
|
|
|
|
|
|
|
|
Print in landscape for best results |
Last updated on |
May 15, 2018 |
|
Source:
Official 45th Day headcount as reported by colleges. |
|
Maricopa Community College District • Office of
Institutional Effectiveness • Maricopa Trends |
|
https://asa.maricopa.edu/departments/institutional-effectiveness/data-and-projects/maricopa-trends |
|
|
|
|
|
|
|
|
|
|
|
|
|
|
|
|
|