|
|
|
|
|
|
|
|
|
|
|
|
|
|
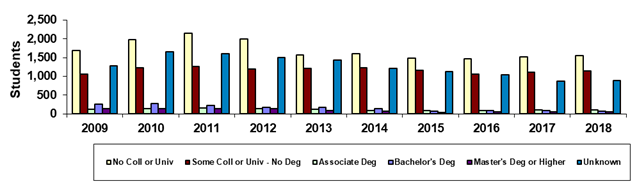
South Mountain Community College |
|
|
Spring 45th Day Admission Status |
|
|
|
|
|
|
|
|
|
|
|
|
|
|
|
|
|
|
|
|
|
|
|
|
|
|
|
|
|
|
|
|
|
|
|
|
|
|
|
|
|
|
|
|
|
|
|
|
|
|
|
|
|
|
|
|
|
|
|
|
|
|
|
|
|
|
|
|
|
|
|
|
|
|
|
|
|
|
|
|
|
|
|
|
|
|
|
|
|
|
|
|
|
|
|
|
|
|
|
|
|
|
|
|
|
|
|
|
|
|
|
|
|
|
|
|
|
|
|
|
|
|
|
|
|
|
|
|
|
|
|
|
|
|
|
|
|
|
|
|
|
|
|
|
|
|
|
|
|
|
|
|
|
|
|
|
|
|
Year |
2009 |
2010 |
2011 |
2012 |
2013 |
2014 |
2015 |
2016 |
2017 |
2018 |
|
|
No Coll or Univ |
1,680 |
1,982 |
2,152 |
1,993 |
1,572 |
1,610 |
1,478 |
1,462 |
1,516 |
1,558 |
|
|
Some Coll or Univ - No Deg |
1,053 |
1,233 |
1,257 |
1,188 |
1,218 |
1,225 |
1,157 |
1,062 |
1,117 |
1,152 |
|
|
Associate Deg |
115 |
133 |
152 |
136 |
116 |
90 |
85 |
88 |
98 |
100 |
|
|
Bachelor's Deg |
264 |
270 |
225 |
168 |
176 |
146 |
76 |
96 |
83 |
77 |
|
|
Master's Deg or Higher |
134 |
136 |
132 |
131 |
86 |
75 |
40 |
59 |
52 |
51 |
|
|
Unknown |
1,277 |
1,646 |
1,610 |
1,497 |
1,432 |
1,218 |
1,123 |
1,045 |
864 |
881 |
|
|
Total |
4,523 |
5,400 |
5,528 |
5,113 |
4,600 |
4,364 |
3,959 |
3,812 |
3,730 |
3,819 |
|
|
|
|
|
|
|
|
|
|
|
|
|
|
|
|
|
|
|
|
|
|
|
|
|
|
|
|
% No Coll or Univ |
37.1% |
36.7% |
38.9% |
39.0% |
34.2% |
36.9% |
37.3% |
38.4% |
40.6% |
40.8% |
|
|
% Some Coll or Univ - No Deg |
23.3% |
22.8% |
22.7% |
23.2% |
26.5% |
28.1% |
29.2% |
27.9% |
29.9% |
30.2% |
|
|
% Associate Deg |
2.5% |
2.5% |
2.7% |
2.7% |
2.5% |
2.1% |
2.1% |
2.3% |
2.6% |
2.6% |
|
|
% Bachelor's Deg |
5.8% |
5.0% |
4.1% |
3.3% |
3.8% |
3.3% |
1.9% |
2.5% |
2.2% |
2.0% |
|
|
% Master's Deg or Higher |
3.0% |
2.5% |
2.4% |
2.6% |
1.9% |
1.7% |
1.0% |
1.5% |
1.4% |
1.3% |
|
|
% Unknown |
28.2% |
30.5% |
29.1% |
29.3% |
31.1% |
27.9% |
28.4% |
27.4% |
23.2% |
23.1% |
|
|
|
|
|
|
|
|
|
|
|
|
|
|
|
|
|
|
|
|
|
|
|
|
|
|
|
|
Print in landscape for best results |
Last updated on |
May 15, 2018 |
|
|
Source:
Official 45th Day headcount as reported by colleges. |
|
|
Maricopa Community College District • Office of
Institutional Effectiveness • Maricopa Trends |
|
|
https://asa.maricopa.edu/departments/institutional-effectiveness/data-and-projects/maricopa-trends |
|
|
|
|
|
|
|
|
|
|
|
|
|
|
|
|
|