|
|
|
|
|
|
|
|
|
|
|
|
|
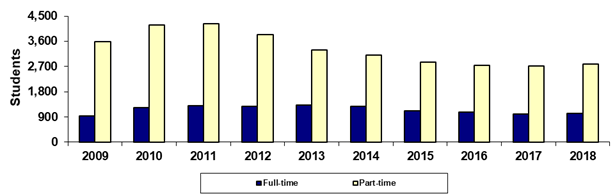
South Mountain Community College |
|
Spring 45th Day Full-time vs Part-time |
|
|
|
|
|
|
|
|
|
|
|
|
|
|
Year |
2009 |
2010 |
2011 |
2012 |
2013 |
2014 |
2015 |
2016 |
2017 |
2018 |
|
Full-time |
934 |
1,228 |
1,307 |
1,287 |
1,320 |
1,266 |
1,108 |
1,072 |
1,014 |
1,027 |
|
Part-time |
3,589 |
4,172 |
4,221 |
3,826 |
3,280 |
3,098 |
2,851 |
2,740 |
2,716 |
2,792 |
|
Sum of Colleges* |
4,523 |
5,400 |
5,528 |
5,113 |
4,600 |
4,364 |
3,959 |
3,812 |
3,730 |
3,819 |
|
|
|
|
|
|
|
|
|
|
|
|
|
% Full-time |
20.7% |
22.7% |
23.6% |
25.2% |
28.7% |
29.0% |
28.0% |
28.1% |
27.2% |
26.9% |
|
% Part-time |
79.3% |
77.3% |
76.4% |
74.8% |
71.3% |
71.0% |
72.0% |
71.9% |
72.8% |
73.1% |
|
|
|
|
|
|
|
|
|
|
|
|
|
Print in landscape for best results |
Last updated on |
May 15, 2018 |
|
Source:
Official 45th Day headcount as reported by colleges. |
|
Maricopa Community College District • Office of
Institutional Effectiveness • Maricopa Trends |
|
https://asa.maricopa.edu/departments/institutional-effectiveness/data-and-projects/maricopa-trends |
|
|
|
|
|
|
|
|
|
|
|
|
|
|
|
|
|
|
|
|
|
|
|
|
|
|
|
|
|
|
|
|
|
|
|
|
|
|
|
|
|
|
|
|
|
|
|
|
|
|
|
|
|
|
|
|
|
|
|
|
|
|
|
|
|
|
|
|
|
|
|
|
|
|
|
|
|
|
|
|
|
|
|
|
|
|
|
|
|
|
|
|
|
|
|
|
|
|
|
|
|
|
|
|
|
|
|
|
|
|
|
|
|
|
|
|
|
|
|
|
|
|
|
|
|
|
|
|
|
|
|
|
|
|
|
|
|
|
|
|
|
|
|
|
|
|
|
|
|
|
|
|
|
|
|
|
|
|
|
|
|
|
|
|
|
|
|
|
|
|