|
|
|
|
|
|
|
|
|
|
|
|
|
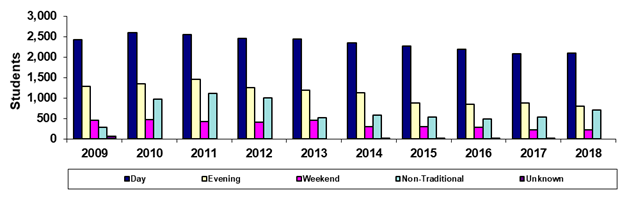
South Mountain Community College |
|
Spring 45th Day Primary Time of Attendance
Headcount |
|
|
|
|
|
|
|
|
|
|
|
|
|
|
Year |
2009 |
2010 |
2011 |
2012 |
2013 |
2014 |
2015 |
2016 |
2017 |
2018 |
|
Day |
2,418 |
2,594 |
2,553 |
2,457 |
2,438 |
2,347 |
2,259 |
2,191 |
2,082 |
2,098 |
|
Evening |
1,286 |
1,353 |
1,447 |
1,252 |
1,195 |
1,124 |
878 |
843 |
874 |
797 |
|
Weekend |
463 |
477 |
417 |
403 |
449 |
307 |
295 |
285 |
227 |
221 |
|
Non-Traditional |
291 |
976 |
1,111 |
1,001 |
518 |
583 |
526 |
488 |
540 |
703 |
|
Unknown |
65 |
0 |
0 |
0 |
0 |
3 |
1 |
5 |
7 |
0 |
|
Total |
4,523 |
5,400 |
5,528 |
5,113 |
4,600 |
4,364 |
3,959 |
3,812 |
3,730 |
3,819 |
|
|
|
|
|
|
|
|
|
|
|
|
|
% Day |
53.5% |
48.0% |
46.2% |
48.1% |
53.0% |
53.8% |
57.1% |
57.5% |
55.8% |
54.9% |
|
% Evening |
28.4% |
25.1% |
26.2% |
24.5% |
26.0% |
25.8% |
22.2% |
22.1% |
23.4% |
20.9% |
|
%Weekend |
10.2% |
8.8% |
7.5% |
7.9% |
9.8% |
7.0% |
7.5% |
7.5% |
6.1% |
5.8% |
|
%Non-Traditional |
6.4% |
18.1% |
20.1% |
19.6% |
11.3% |
13.4% |
13.3% |
12.8% |
14.5% |
18.4% |
|
%Unknown |
1.4% |
0.0% |
0.0% |
0.0% |
0.0% |
0.1% |
0.0% |
0.1% |
0.2% |
0.0% |
|
|
|
|
|
|
|
|
|
|
|
|
|
Print in landscape for best results |
Last updated on |
May 15, 2018 |
|
Source:
Official 45th Day headcount as reported by colleges. |
|
Maricopa Community College District • Office of
Institutional Effectiveness • Maricopa Trends |
|
https://asa.maricopa.edu/departments/institutional-effectiveness/data-and-projects/maricopa-trends |
|
|
|
|
|
|
|
|
|
|
|
|
|
|