|
|
|
|
|
|
|
|
|
|
|
|
|
|
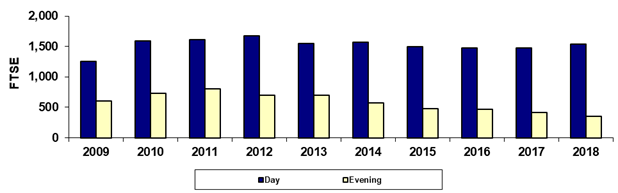
South Mountain Community College |
|
|
Spring 45th Day Day/Evening FTSE |
|
|
|
|
|
|
|
|
|
|
|
|
|
|
|
|
|
|
|
|
|
|
|
|
|
|
|
|
|
|
|
|
|
|
|
|
|
|
|
|
|
|
|
|
|
|
|
|
|
|
|
|
|
|
|
|
|
|
|
|
|
|
|
|
|
|
|
|
|
|
|
|
|
|
|
|
|
|
|
|
|
|
|
|
|
|
|
|
|
|
|
|
|
|
|
|
|
|
|
|
|
|
|
|
|
|
|
|
|
|
|
|
|
|
|
|
|
|
|
|
|
|
|
|
|
|
|
|
|
|
|
|
|
|
|
|
|
|
|
|
|
|
|
|
|
|
|
|
|
|
|
|
|
|
|
|
|
|
Year |
2009 |
2010 |
2011 |
2012 |
2013 |
2014 |
2015 |
2016 |
2017 |
2018 |
|
|
Day |
1,255.6 |
1,594.2 |
1,614.3 |
1,674.3 |
1,552.9 |
1,565.5 |
1,496.3 |
1,478.9 |
1,479.1 |
1,535.7 |
|
|
Evening |
608.7 |
726.6 |
805.0 |
696.4 |
699.2 |
571.9 |
480.4 |
466.1 |
420.4 |
354.1 |
|
|
Total |
1,864.3 |
2,320.8 |
2,419.3 |
2,370.7 |
2,252.1 |
2,137.5 |
1,976.7 |
1,945.1 |
1,899.5 |
1,889.8 |
|
|
|
|
|
|
|
|
|
|
|
|
|
|
|
% Day |
67.4% |
68.7% |
66.7% |
70.6% |
69.0% |
73.2% |
75.7% |
76.0% |
77.9% |
81.3% |
|
|
% Evening |
32.6% |
31.3% |
33.3% |
29.4% |
31.0% |
26.8% |
24.3% |
24.0% |
22.1% |
18.7% |
|
|
|
|
|
|
|
|
|
|
|
|
|
|
|
Due to rounding, the sum
of the numbers may not equal the Total. |
|
|
Last updated on |
May 15, 2018 |
|
|
Print in landscape for best results |
|
|
|
|
Source:
Official 45th Day FTSE numbers as reported by the colleges after
manual adjustments (unaudited). |
|
|
Maricopa Community College District • Office of
Institutional Effectiveness • Maricopa Trends |
|
|
https://asa.maricopa.edu/departments/institutional-effectiveness/data-and-projects/maricopa-trends |
|
|
|
|
|
|
|
|
|
|
|
|
|
|
|
|