|
|
|
|
|
|
|
|
|
|
|
|
|
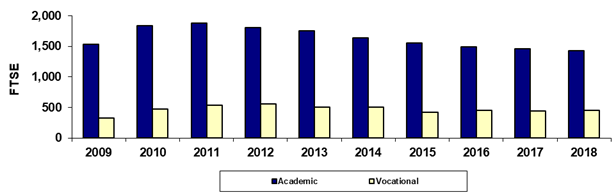
South Mountain Community College |
|
Spring 45th Day Academic/Vocational FTSE |
|
|
|
|
|
|
|
|
|
|
|
|
|
|
Year |
2009 |
2010 |
2011 |
2012 |
2013 |
2014 |
2015 |
2016 |
2017 |
2018 |
|
Academic |
1,532.0 |
1,842.3 |
1,882.5 |
1,808.0 |
1,750.6 |
1,636.9 |
1,549.8 |
1,496.3 |
1,461.0 |
1,433.9 |
|
Vocational |
332.3 |
478.5 |
536.9 |
562.7 |
501.5 |
500.5 |
426.9 |
448.8 |
438.5 |
455.9 |
|
Total |
1,864.3 |
2,320.8 |
2,419.3 |
2,370.7 |
2,252.1 |
2,137.5 |
1,976.7 |
1,945.1 |
1,899.5 |
1,889.8 |
|
|
|
|
|
|
|
|
|
|
|
|
|
% Academic |
82.2% |
79.4% |
77.8% |
76.3% |
77.7% |
76.6% |
78.4% |
76.9% |
76.9% |
75.9% |
|
% Vocational |
17.8% |
20.6% |
22.2% |
23.7% |
22.3% |
23.4% |
21.6% |
23.1% |
23.1% |
24.1% |
|
|
|
|
|
|
|
|
|
|
|
|
|
Due to rounding, the sum
of the numbers may not equal the Total. |
|
|
Last updated on |
May 15, 2018 |
|
Print in landscape for best results |
|
|
|
Source:
Official 45th Day FTSE numbers as reported by the colleges after
manual adjustments (unaudited). |
|
Maricopa Community College District • Office of
Institutional Effectiveness • Maricopa Trends |
|
https://asa.maricopa.edu/departments/institutional-effectiveness/data-and-projects/maricopa-trends |
|
|
|
|
|
|
|
|
|
|
|
|
|
|