|
|
|
|
|
|
|
|
|
|
|
|
|
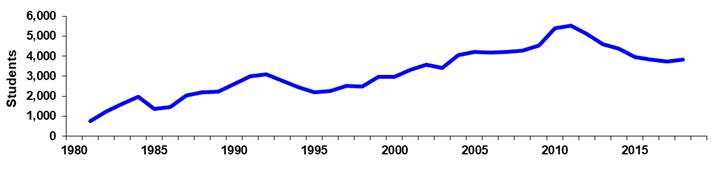
South Mountain Community College |
|
Spring 45th Day Historical Headcount |
|
|
|
|
|
|
|
|
|
|
|
|
|
|
|
|
|
|
|
|
|
|
|
|
|
Year |
1980 |
1981 |
1982 |
1983 |
1984 |
1985 |
1986 |
1987 |
1988 |
1989 |
|
Day |
|
254 |
564 |
792 |
1,127 |
758 |
943 |
1,200 |
1,417 |
1,400 |
|
% Change |
|
0.0% |
122.0% |
40.4% |
42.3% |
-32.7% |
24.4% |
27.3% |
18.1% |
-1.2% |
|
Evening |
|
484 |
680 |
835 |
839 |
601 |
513 |
820 |
779 |
826 |
|
% Change |
|
0.0% |
40.5% |
22.8% |
0.5% |
-28.4% |
-14.6% |
59.8% |
-5.0% |
6.0% |
|
Total |
|
738 |
1,244 |
1,627 |
1,966 |
1,359 |
1,456 |
2,020 |
2,196 |
2,226 |
|
% Change |
|
0.0% |
68.6% |
30.8% |
20.8% |
-30.9% |
7.1% |
38.7% |
8.7% |
1.4% |
|
|
|
|
|
|
|
|
|
|
|
|
|
Year |
1990 |
1991 |
1992 |
1993 |
1994 |
1995 |
1996 |
1997 |
1998 |
1999 |
|
Day |
1,545 |
1,725 |
1,804 |
1,778 |
1,620 |
1,415 |
1,340 |
1,487 |
1,511 |
2,039 |
|
% Change |
10.4% |
11.7% |
4.6% |
-1.4% |
-8.9% |
-12.7% |
-5.3% |
11.0% |
1.6% |
34.9% |
|
Evening |
1,050 |
1,259 |
1,297 |
1,003 |
835 |
789 |
910 |
1,010 |
979 |
929 |
|
% Change |
27.1% |
19.9% |
3.0% |
-22.7% |
-16.7% |
-5.5% |
15.3% |
11.0% |
-3.1% |
-5.1% |
|
Total |
2,595 |
2,984 |
3,101 |
2,781 |
2,455 |
2,204 |
2,250 |
2,497 |
2,490 |
2,968 |
|
% Change |
16.6% |
15.0% |
3.9% |
-10.3% |
-11.7% |
-10.2% |
2.1% |
11.0% |
-0.3% |
19.2% |
|
|
|
|
|
|
|
|
|
|
|
|
|
Year |
2000 |
2001 |
2002 |
2003 |
2004 |
2005 |
2006 |
2007 |
2008 |
2009 |
|
Day |
1,771 |
1,822 |
1,869 |
1,778 |
2,101 |
2,088 |
2,213 |
2,194 |
0 |
0 |
|
% Change |
-13.1% |
2.9% |
2.6% |
-4.9% |
18.2% |
-0.6% |
6.0% |
-0.9% |
0.0% |
0.0% |
|
Evening |
1,198 |
1,485 |
1,706 |
1,624 |
1,948 |
2,109 |
1,978 |
2,002 |
0 |
0 |
|
% Change |
29.0% |
24.0% |
14.9% |
-4.8% |
20.0% |
8.3% |
-6.2% |
1.2% |
0.0% |
0.0% |
|
Total |
2,969 |
3,307 |
3,575 |
3,402 |
4,049 |
4,197 |
4,191 |
4,196 |
4,259 |
4,523 |
|
% Change |
0.0% |
11.4% |
8.1% |
-4.8% |
19.0% |
3.7% |
-0.1% |
0.1% |
1.5% |
6.2% |
|
|
|
|
|
|
|
|
|
|
|
|
|
Year |
2010 |
2011 |
2012 |
2013 |
2014 |
2015 |
2016 |
2017 |
2018 |
|
|
Day |
0 |
|
|
|
|
|
|
|
|
|
|
% Change |
0.0% |
|
|
|
|
|
|
|
|
|
|
Evening |
0 |
|
|
|
|
|
|
|
|
|
|
% Change |
0.0% |
|
|
|
|
|
|
|
|
|
|
Total |
5,400 |
5,528 |
5,113 |
4,600 |
4,364 |
3,959 |
3,812 |
3,730 |
3,819 |
|
|
% Change |
19.4% |
2.4% |
-7.5% |
-10.0% |
-5.1% |
-9.3% |
-3.7% |
-2.2% |
2.4% |
|
|
|
|
|
|
|
|
|
|
|
|
|
|
|
|
|
|
|
|
|
|
|
|
|
|
Print in landscape for
best results |
|
|
|
|
|
Last updated on |
May 15, 2018 |
|
Source:
Official 45th Day headcount as reported by colleges. |
|
Maricopa Community College District • Office of
Institutional Effectiveness • Maricopa Trends |
|
https://asa.maricopa.edu/departments/institutional-effectiveness/data-and-projects/maricopa-trends |
|
|
|
|
|
|
|
|
|
|
|
|
|
|
|
|